[cross border search] has provided precise business intelligence to over 10,000 enterprises based on global customs data. Our services cover the entire foreign trade industry chain, including cross-border trade solutions, CRM, and digital marketing. To request a free trial or learn more about our services, please contact our customer support team today!
Introduction: Shifting Paradigms in Export Markets Under the Convergence of Dual Cycles
In the first quarter of 2026, the global medical device trade stands at the intersection of two historic cycles: the explosion of home healthcare demand driven by accelerating aging in developed Western economies, and the supply-side momentum fueled by China’s “Silver Economy” policies and trade facilitation reforms. Under these dual forces, Chinese medical device exports are experiencing intense structural shifts despite stable overall volumes.
Taking three representative types of home medical equipment as observation samples—Oxygen Generators (HS Code 84196011, capacity ≥15,000 m³/h), Digital Thermometers/Pyrometers (HS Code 90251990), and Massage Appliances (HS Code 90191010)—total export value reached $1.21 billion in Q1 2026, a slight year-on-year increase of 0.8%. While the figures appear steady, the internal structural transformation clearly outlines the competitive landscape for the next five to ten years.

1. Demand Restructuring: The Silver Wave Driving a Paradigm Shift in Medical Scenarios
1. Global aging is reshaping the medical device consumption landscape at an unprecedented pace.
According to data from Eurostat, the proportion of the population aged over 65 in the EU will reach 23.1% in 2026, compared to 18.9% in the United States, while Japan is approaching 30%. This demographic shift has brought about a fundamental change: the primary setting for chronic disease management and routine health monitoring is rapidly moving from hospital wards to the home living room.
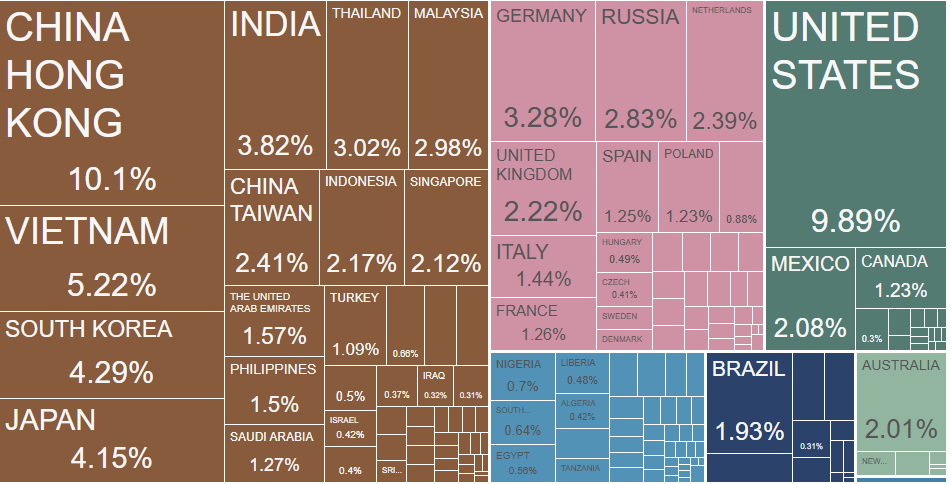
Image Source: Cross Border Search Platform
2. This shift is driven by three key factors.
First, rising healthcare costs are forcing systemic reforms. Following the European energy crisis and high inflation (with the Dutch TTF gas benchmark once exceeding €60/MWh). the costs of transportation and labor for traditional home care have surged. Consequently, remote monitoring and home-use devices have emerged as systemic solutions. Second, generational shifts in consumption are reshaping demand. The new generation of seniors is moving from “passive treatment” to “proactive health management.” Massage appliances, thermometers, and home oxygen concentrators are no longer just medical tools—they are lifestyle-integrated wellness companions. Third, policy frameworks are adapting. U.S. Medicare is expanding reimbursement for Remote Patient Monitoring (RPM); Germany’s Digital Healthcare Act (DVG) prioritizes certification for smart devices; and Japan’s Long-Term Care Insurance Act now includes home care equipment in its reimbursement scope. Countries worldwide are elevating “aging in place” to a national strategy.
3. These structural changes on the demand side are directly reflected in Q1 2026 export data.
The German market saw an 18.83% year-on-year surge in export value, with average unit prices reaching $9.30. Despite a slight 7.34% drop in export volume, the total value rose sharply, signaling a shift toward high-value-added products. This aligns with Germany’s Industry 4.0 strategy, which favors precision home medical equipment—smart, interconnected devices with data interoperability now receive procurement priority and show significantly lower price sensitivity than low-end categories.
The U.S. market remains the “anchor” of exports, accounting for a dominant 27.81% share. However, a 2.4% decline in total value and a drop in average price to $7.39 reveal a structural shift: competition for basic, low-to-mid-end equipment has reached a fever pitch, intensifying price pressure. Yet, a marginal 0.43% increase in export volume suggests that the baseline demand remains resilient. The market is bifurcating—the bottom tier is driven by volume and price, while the upper tier is defined by technical quality.
2. Core Market Segmentation: The Differentiated Logic of Five Major Growth Engines
United States: The Legacy Giant Entering a Growth Transition.
A 27.81% market share means that every shift in the U.S. market ripples through the entire export landscape. The current 2.4% decline in value does not signal disappearing demand, but rather a reshaping of the competitive landscape. Price pressures stem primarily from an oversupply of low-to-mid-end categories and the migration of certain orders to Southeast Asia. However, according to ABI Research, global smart home medical device shipments are projected to grow from 124 million units in 2026 to 170 million by 2030. Furthermore, the U.S. elderly care equipment market is expected to reach $6.75 billion by 2033, with a CAGR of 7.42%. This indicates that long-term growth in the U.S. remains solid. The key lies in transitioning from “exporting commodities” to “exporting value”—upgrading smart features (e.g., Bluetooth connectivity, AI data management) and leveraging compliance premiums via FDA or UL certifications to break free from price wars.
Germany: The Benchmark for High-End Upgrades.
With an 18.83% increase in value and an average unit price of $9.30, Germany emerged as the most significant value-growth pole in Q1 2026. The “scissors gap”—where volume slightly decreased while value surged—proves that German importers and consumers are voting for high-value Chinese products with their wallets. This is driven by policy levers: Germany’s Digital Healthcare Act (DVG) provides fast-track certification and procurement priority for home devices featuring data interconnectivity and smart monitoring. For enterprises capable of navigating EU MDR certification and aligning with Industry 4.0 technical standards, Germany serves as the ultimate testing ground for evolving from “cost-effective exports” to “tech-driven brand exports.”
Russia: The Explosion of an Emerging Market.
A 49.10% surge in value and a 37.08% increase in volume make Russia a high-growth engine. This simultaneous rise in price and volume differs from early-stage “low-price dumping,” indicating that the Russian market is undergoing a consumption upgrade. Channels and end-consumers are now willing to pay a reasonable premium for quality Chinese brands. The signing of the Sino-Russian Memorandum of Understanding on Medical Device Cooperation has further lowered trade barriers. This growth momentum is sustainable; current strategies should prioritize rapid brand awareness and channel network building rather than premature price competition.
3. High-Growth Zones: The Collective Rise of Emerging Economies
Looking away from the core markets, a series of even more exhilarating figures emerge. Belarus (+197.83%), Norway (+129.29%), Uzbekistan (+112.55%), Hungary (+67.62%), Israel (+44.40%), Algeria (+43.33%), Peru (+41.72%), Denmark (+36.11%), and Saudi Arabia (+35.72%)—these nine markets constitute the “High-Growth Phalanx” of Q1 2026.
From a geographical perspective, distinct growth belts are taking shape:
- Central Asia and Eastern Europe (Russia, Belarus, Uzbekistan, Hungary): This belt resonates strongly with the Belt and Road Initiative (BRI) infrastructure projects and regional economic integration.
- Middle East Growth Poles (Saudi Arabia, Israel): Growth here is directly linked to economic diversification strategies, such as the construction of medical cities under Saudi Vision 2030.
- Latin American Growth Points (Peru): Benefiting from the tariff dividends brought by the upgraded China-Peru Free Trade Agreement.
The Nordic markets, represented by Norway (Average Unit Price: $74.64) and Denmark (with rising prices and 36% value growth), are ideal for high-end products with technical barriers or unique features. In these regions, enterprises should prioritize profit margins and brand benchmarking over sheer volume. Meanwhile, the simultaneous rise in both price and volume in Uzbekistan indicates that a high-potential incremental market is entering a prime window of opportunity.
4. The Value Pyramid: A Tiered Strategy from $2 to $215
Average unit price is the core metric for determining product positioning and competitive strategy. Export data from Q1 2026 outlines a distinct Price-Value Pyramid:
- The Pyramid Peak ($100+): Iceland ($215.63), Malta ($156.53), and Austria ($100.86). While these markets have smaller volumes, they represent the world’s highest willingness to pay. Iceland’s export value surged 219.86% year-on-year; although influenced by a low base, its high average price reflects a rigid demand for specialized equipment performance in polar environments. The strategic significance here is not sales volume, but brand authority—becoming a supplier to Iceland or Austria serves as a premier endorsement of technology and quality.
- The Upper-Middle Tier ($20–$60): Taiwan, China ($21.78), Sweden ($21.86), and Norway ($74.64). These markets combine steady growth with high quality sensitivity. Taiwan (China) saw a 15.69% increase in value and a 25.53% increase in volume, maintaining a healthy balance. Sweden saw value grow by 26.51% despite a decrease in volume, making it ideal for entry via technological differentiation. Leveraging RCEP tariff preferences is key to establishing long-term premium brand recognition in these regions.
- The Hub Tier (~$8): Hong Kong, China ($8.45), with a 25.90% increase in value. Hong Kong’s role has evolved from a simple transit port to a service export hub. Institutional advantages—such as financing, compliance certification, brand packaging, and the mutual recognition of medical device certifications within the Greater Bay Area—make it a critical pivot point for the global branding of Chinese medical devices.
- The Mainstream Tier ($5–$10): Core markets including the US, Germany, South Korea, and Russia. In this tier, competitive strategies must be highly segmented:
- Price-pressured markets (US, South Korea): Respond with both product upgrades and cost optimization.
- Value-upgrading markets (Germany): Build a moat through technical certifications and quality premiums.
- Growth markets (Russia): Capture market share through aggressive brand building.
5. Early Warning Map: Recession Signals and Structural Risks
In the Q1 2026 data, signals from declining markets also warrant in-depth analysis.
The cliff-like drop of -97.82% in export value to the Chinese local market is not a disappearance of demand, but rather a result of the “Internal Circulation Priority” policy. The 2026 Action Plan for the High-Quality Development of China’s Silver Economy has strengthened incentives for domestic substitution and local procurement, creating a temporary “crowding-out effect” on exports. This serves as a reminder to export-oriented enterprises that shifts in domestic policy can directly alter resource allocation on the supply side, necessitating the establishment of a dynamic balance between domestic and international markets.
The export declines in Singapore (-18.43%) and Vietnam (-9.23%) likely reflect a restructuring of the Southeast Asian industrial chain. Regional transit patterns are decentralizing from Singapore to other hubs, while Vietnam’s local manufacturing substitution capabilities are growing. In Central Asia, Kyrgyzstan (-55.78%) experienced a sharp correction following previous high-speed growth, highlighting the high-volatility nature of emerging markets. In such markets, a “small steps, fast iterations” strategy should be adopted—testing market stability with small orders and delaying large-scale deployment until demand signals are clear.
6. Dual Policy Drivers: From Domestic Foundations to Global Compliance
To understand the export landscape of Q1 2026, one must consider two major pillars of policy support.
Domestic “Silver Economy” Policies: Strengthening the Industrial Foundation
By late 2025, eight ministries, including the Ministry of Civil Affairs, jointly issued 14 measures to cultivate market entities in elderly care services. In February 2026, the State Council’s executive meeting explicitly stated the goal to “leverage consumption subsidies to create new scenarios and business models for silver consumption.” Furthermore, “trade-in” policies expanded subsidies to include age-appropriate home products. This intensive rollout of policies has nurtured a massive domestic market, allowing categories such as massage appliances, temperature monitoring devices, and home oxygen concentrators to undergo rapid iteration and validation within China. As a result, their cost structures and quality standards have achieved significant international competitiveness.
Trade Facilitation Reforms: Lowering Export Barriers
The new Regulations on the Administration of Export Sales Certificates for Medical Devices, effective May 2026, creatively established Category II certificates. This opened a legal pathway for products designed exclusively for export that are not registered in China, with processing times capped at 20 working days and electronic certificates available instantly. Additionally, the export tax rebate rate was increased from 13% to 15%. For massage appliances (HS 90191010), which see annual exports exceeding $1 billion, this single adjustment adds approximately $20 million in profit margin to the industry. Furthermore, electronic tax refunds have compressed the cycle to within one month, boosting capital turnover efficiency by 60%. These policy dividends have directly translated into enhanced international competitiveness for Chinese enterprises.
7. Strategic Recommendations: Building a “Policy-Market-Product” Three-Dimensional Response System
Based on the panoramic analysis above, it is recommended that export enterprises establish a dynamic three-dimensional strategic framework:
- Market Dimension: Layered Deep Cultivation.
- Core Markets (US, Germany, Japan): Focus on protecting market share and enhancing value. The US should prioritize smart product upgrades; Germany should focus on breakthroughs in high-end certifications; Japan should focus on large-scale cost reduction.
- High-Growth Markets (Russia, Central Asia, Middle East): Prioritize rapid distribution and brand building to seize policy windows.
- High-End Benchmark Markets (Nordics, Austria): Seek brand positioning and prestige rather than sheer volume.
- Product Dimension: Gradient Layout.
- For “Volume Up, Price Down” markets (South Korea, Japan), launch streamlined, functional product lines to drive penetration through cost-performance.
- For “Price Up, Volume Stable” markets (Germany, Sweden, Taiwan), strengthen technical barriers and quality premiums.
- For Emerging Markets (Russia, Uzbekistan), provide classic, durable products to build trust through reliability and service networks.
- Policy Dimension: Proactive Alignment.
- Real-time monitoring of Silver Economy policies and healthcare reimbursement scope changes in the West to anticipate demand catalysts.
- Leverage domestic policies—such as increased export tax rebates and Category II certificate channels—to build a compliance moat for new market entry.
- Monitor the impact of multilateral agreements like RCEP and DEPA on cross-border medical data flow and tariff preferences to optimize compliance systems ahead of time.
Conclusion: In an Era of Structural Differentiation, Choice Defines the Outcome
The Q1 2026 export data reveals more than just simple shifts in volume. it signifies a profound reshaping of the global industrial landscape. The rigid demand driven by aging populations in the West, the industrial foundation laid by China’s domestic Silver Economy, and the systemic relaxation of foreign trade policies have converged to create a historic window for global expansion.
However, this window will not stay open forever. As the market shifts from “Scale Expansion” to “Quality Enhancement”. the core of competition has evolved from “who can manufacture” to “who can deliver the right value in the right market.” The price pressures in the U.S. versus the value premiums in Germany; the high-volume, low-margin model in Korea and Japan versus the high-end barriers in the Nordics; and the explosive growth in Russia versus the high volatility in Kyrgyzstan—these simultaneous divergences are the hallmarks of a maturing market.
In this sense, the export data of 2026 is not merely a summary of the past, but a strategic roadmap for the future. The depth to which this map is interpreted will determine who emerges from the wave of “Made in China” global expansion over the next five years to become a definer of the global home medical device industry.